Best Route Planning Software in 2025
This guide compares Track-POD, RouteManager, Circuit, and Upper, covering features, pricing, routing quality, and best-fit scenarios to help businesses choose the best route planning software for 2025.
Read More

Delivery software without analytics and reports means only one thing: you'll need more software systems.
In order to evaluate your staff's performance or make any informed decision for that matter, you need to be able to see metrics and assess your progress over time.
We've covered shipment analytics & reports on this blog before, most recently with our deep dive into predictive analytics in route planning.
Today, we take a look at all the shipping reports available in Track-POD.
Before we start, let's discuss the types of shipping reports. Not by the metrics they contain but by the format they come in.
Real-time shipping reports is the data you can retrieve instantly to analyze current performance. This type of data is usually organized around the metrics that reflect daily operations.
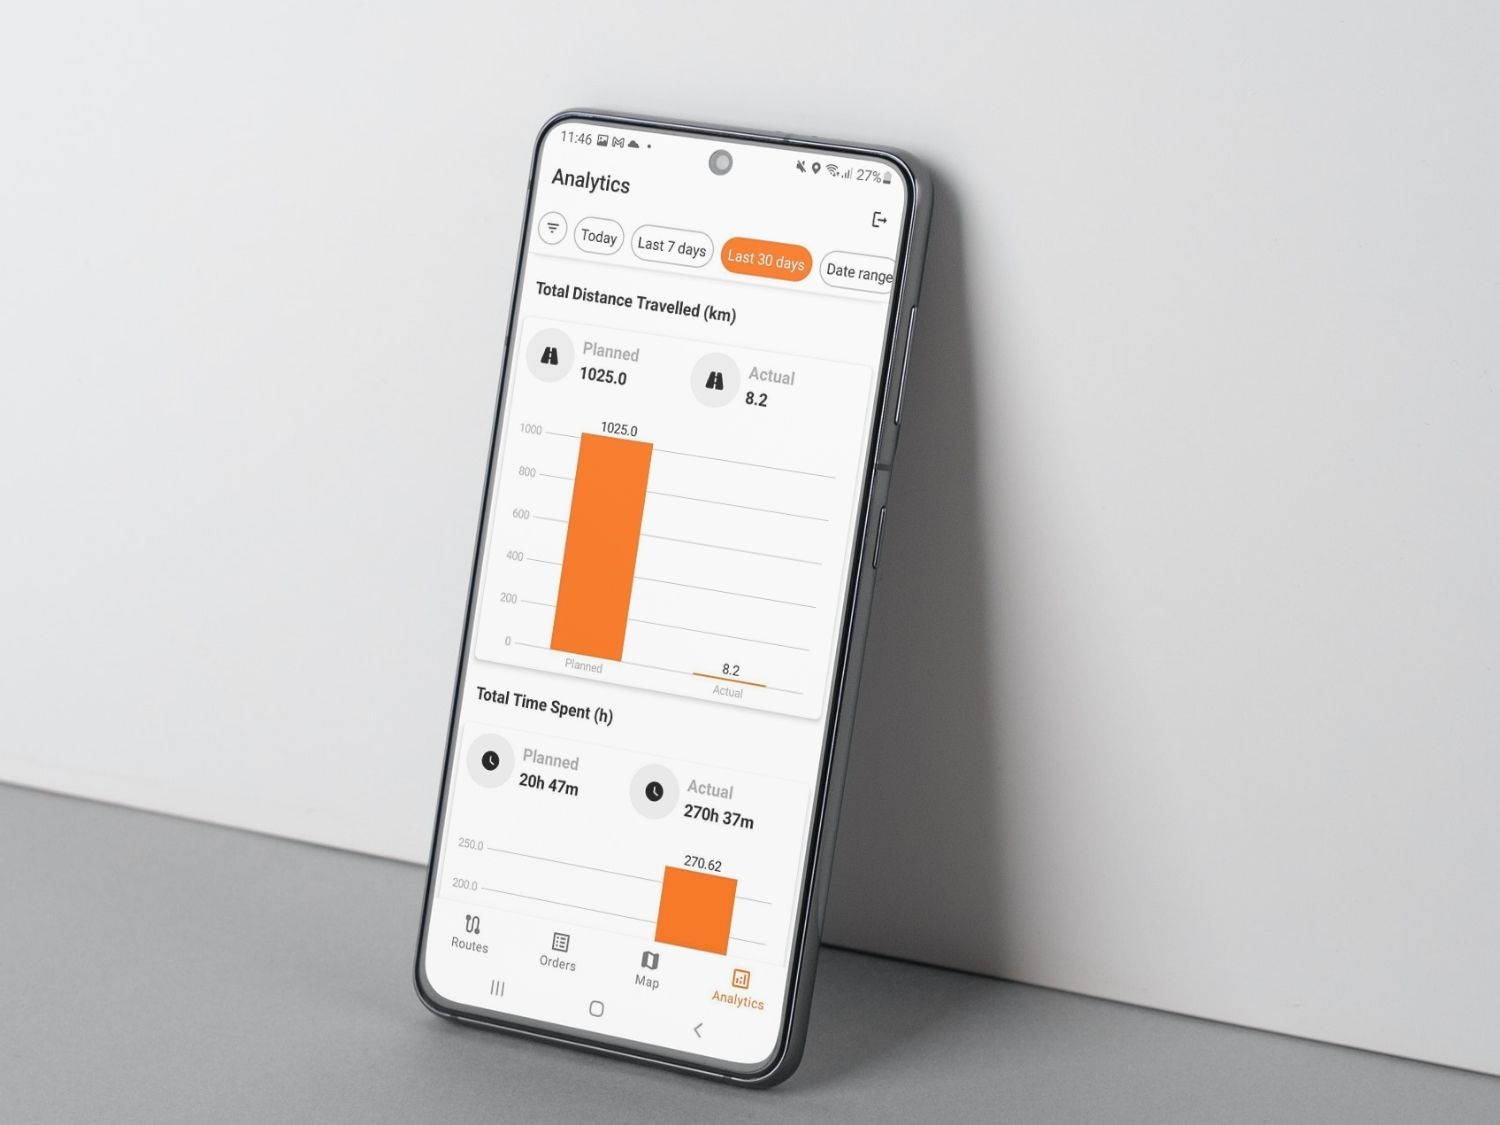
In Track-POD delivery software, for example, real-time analytics are available in the web dispatcher dashboard as well as the mobile app for the route manager (Android only).

Ready-made shipping reports is a shortcut every manager will appreciate. Instead of exporting shipment analytics and compiling segregated data into reports, you get to use the reports populated with data automatically.
Ready-made reports will differ from system to system but what matters is that you can save time putting together a report for your stakeholders.
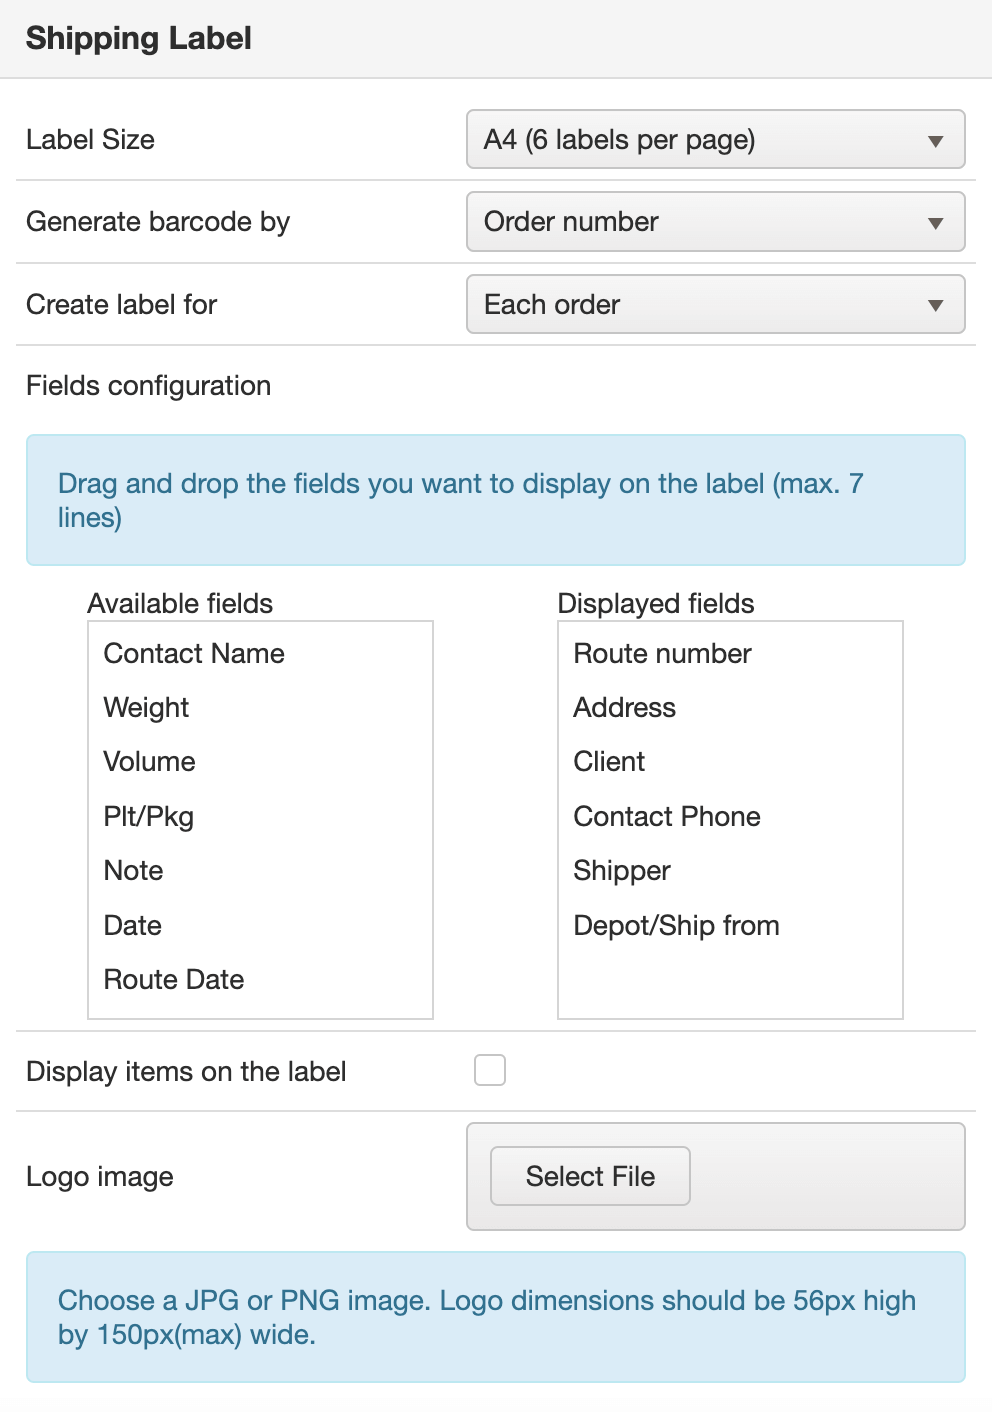
Shipping labels is a prerequisite for load confirmation. First, you customize and print shipping labels. Second, you use the barcode scanner app to check that the loading is correct for the route.
Load planning and load confirmation, as well as delivery confirmation, are crucial steps in building an efficient delivery process with little to no shipping mistakes and customer disputes.

Of course, no shipping reports provider knows your exact operational needs. This is why in addition to ready-made reports it makes sense to have reports that you can customize.
Customization in this case goes beyond branding your shipping labels with the company logo. Choose what data you want to report on and make sure your shipping reports are flexible enough to feature the data points you need.
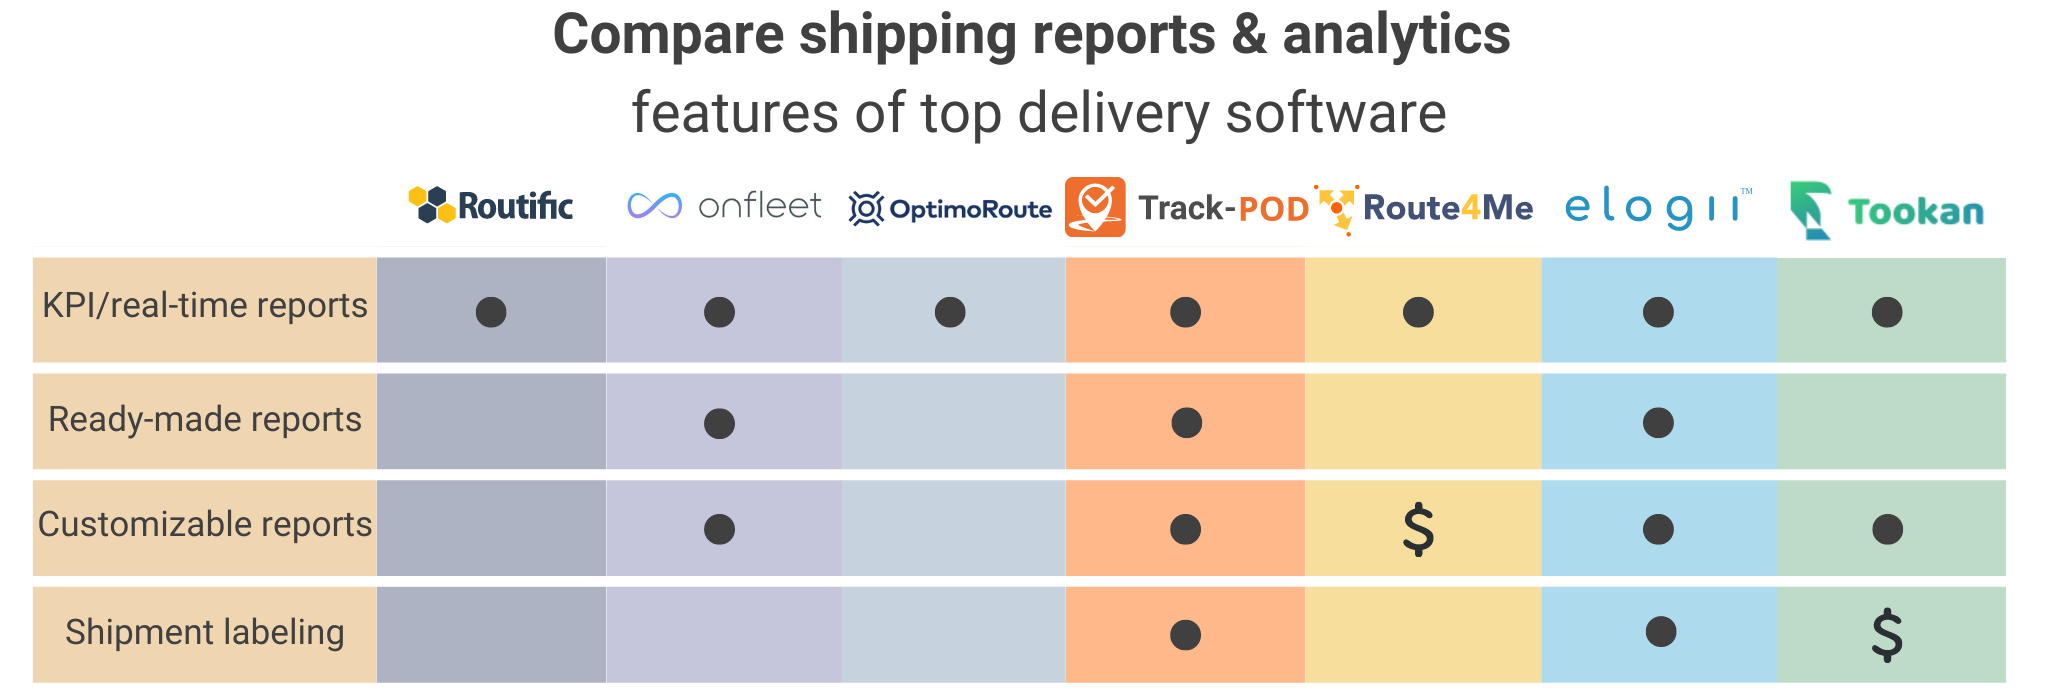
Now that you know what kind of formats shipping reports come in, you can compare top-rated providers of delivery management software and see what kind of reporting capacity they have.

Track-POD offers a full range of shipment analytics: from real-time insights on mobile to KPIs (DIFOT, OTIF, etc.) and historical reports.
Let's look at the shipping reports one by one to get a good overview of your options.
Driver Statistics is a shipping report invaluable to delivery operations that employ more than one driver.
Especially if you're working with contract drivers and dealing with a high driver turnover - you need to make sure you can evaluate driver performance correctly.
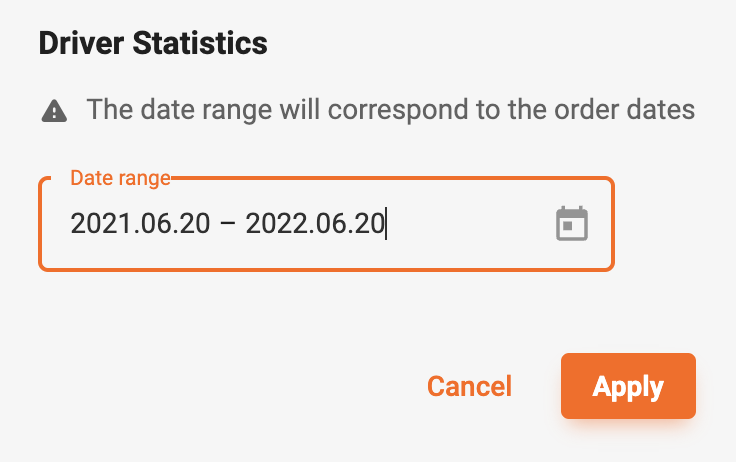
Like with all Track-POD shipping reports, you get to specify a date range for the data. As far as the insights required for driver performance evaluation are concerned, this is what you get in the report.
You get a day total for every day of service covered in the report, as well as a grand total that helps you compare driver performance over a period of time.

While the Driver Statistics report has data organized around individual drivers, Trip Summary by Routes is meant to give you an overview of all crucial data grouped by route date and code.
From planned vs actual start and finish times as well as mileage to weight, capacity, and pallets - you'll see all the data points needed to asses your routes at a glance.
![]()
The Overview of Orders report is exactly what it sounds like - a full recap of all orders fulfilled over a period of time.
Here, in addition to order and driver data you could find in the above-mentioned reports, you have your depot address and customer data (name, customer code, location, address, municipality, zone, etc.).
The Overview of Items report is how you dive deeper into the Delivery in Full metric. Specifically, account for all items inside specific orders and whether or not they have been delivered to the customer successfully.
![]()
In case you see a drop in your Delivery in Full metric among shipping KPIs, you can select a date range and look into three things.
If you notice that the reason behind rejected items is damage to the package, you can start paying closer attention to load planning and loading itself. If you see that your drivers bring the wrong packages, you might need to implement load checks across the board.
Either way, you get plenty of important insights for improvement.
Cost Savings by Time/Distance is the newest among Track-POD's shipping reports. It offers predictive analytics insights for route planning as it showcases the difference between your planned vs actual distance and time.

Taking into account your costs per km/min, Track-POD will calculate your cost savings to help you make more cost-efficient decisions for the future.
This type of report is something you can share with your stakeholders to translate operational efficiency or inefficiency into money saved or lost.
Shipping reports is a convenient way of aggregating and presenting historical data on the team or individual driver performance.
When assessing delivery software, make sure you pay special attention to shipping reports in addition to real-time analytics and KPIs.
If you have questions about Track-POD's shipping reports and analytics, book a free demo and we'll show you around.